

Table of contents
Overview
APM stands for application performance monitoring. APM is one of the most common methods developers use today to measure the availability, response times, and behavior of applications and services.
Elastic APM, on the other hand, is a free and open application performance monitoring system that is built on top of the ELK Stack (Elasticsearch, Logstash, Kibana, and Beats). Like other APM solutions, Elastic APM allows us to track key performance related information such as requests, responses, database transactions, errors, etc. Elastic APM ships with support for Java, Go, Node.js, Python, Ruby, .NET, and JavaScript.
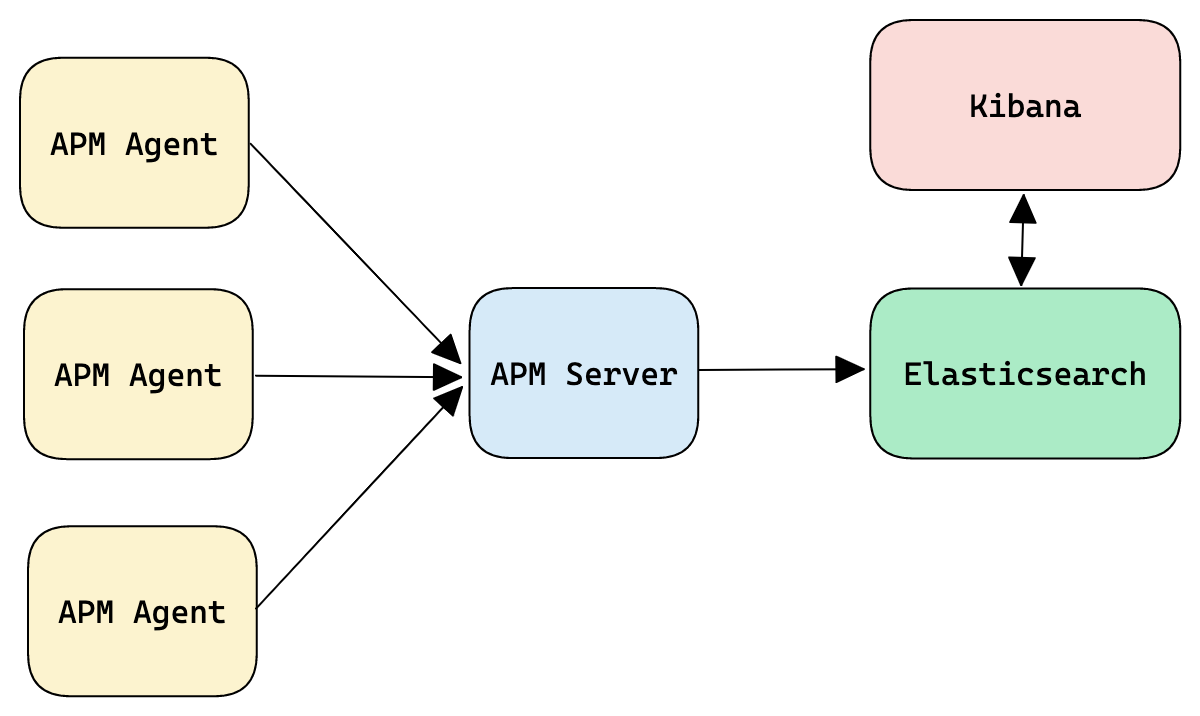
The Elastic APM solution is made up of four building blocks:
- Elasticsearch for data storage and indexing
- Kibana for analyzing and visualizing the data
- APM server
- APM agent
APM agents are in charge of gathering performance data and sending it to the APM server. The APM server is in charge of getting the data, transforms the data into Elasticsearch documents, and sending it to Elasticsearch for storage.
 |
|
|---|---|
| Figure 1: APM clients and server. |
Comments